Let’s continue unfolding the story of software quality monitoring on a real project.
In the previous post, we saw that the price of setting up a quality assessment process was rather short (under one day).
But this is just half the story: producing numbers and dashboards is a nice technical feat but keeping these results in a vacuum produces nothing useful.
So what now? Is software quality monitoring worth the investment, and can the project benefit from it?
Using a software quality monitoring dashboard
Integrating the software quality management tool Squore in our development pipeline had two immediate effects: we could easily explore our projects focusing on the data and on the quality indicators.
As the requirements, code, checkers and test results regularly flowed into the dashboard, we could:
Focus on data
Observe the breakdown and status growth of each project component (aka “artefacts”)
As each artefact is rated, it’s easy to locate parts of the project needing attention.
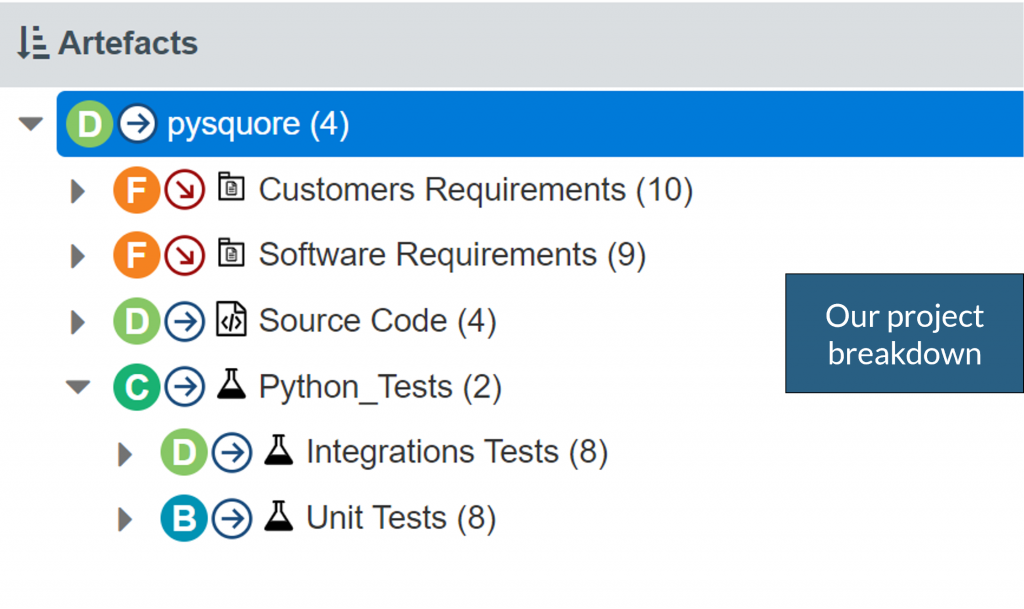
In this view, we quickly see customer and software requirements ratings deteriorating. Clicking on them will narrow down the dashboard to the requirements view, where the issue can quickly be investigated.
Focus on quality indicators
Each dashboard is built around a theme, which helps check a specific quality indicator, and focus on faulty artefacts for this particular indicator.

With the complexity heat map, we get a good sense of the overall project complexity, and spot what functions are more complex. Fortunately, there are not so many complex functions in our project, and even better, they are not the largest ones.
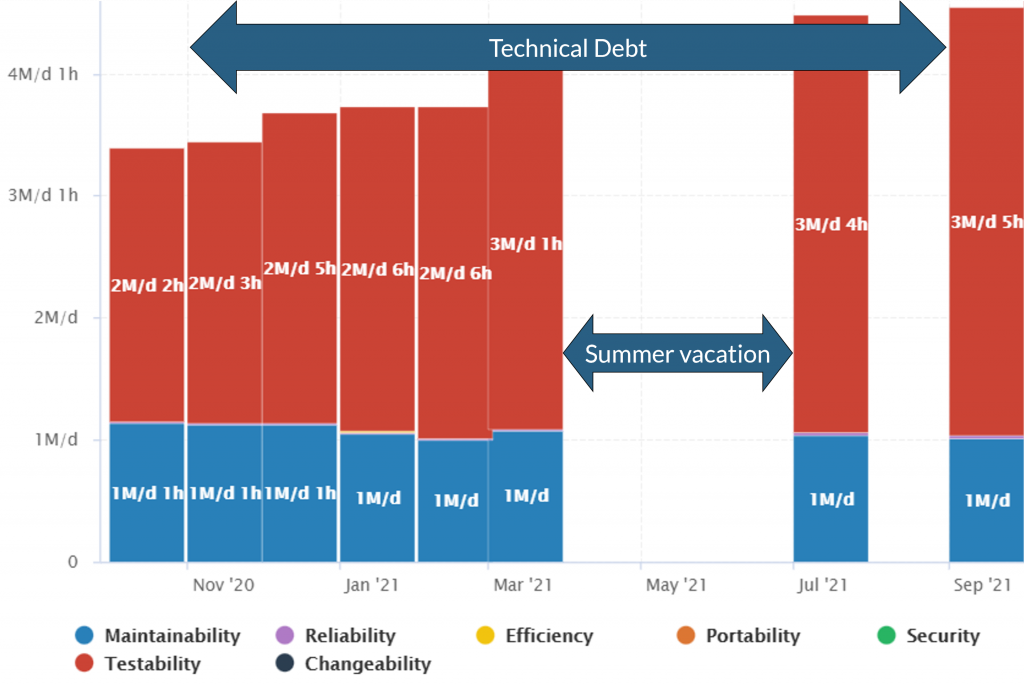
The technical debt trend is a sure way to visualize development activity (or vacation time 😊), and the amount of issues detected on the code.
Setting the software quality objectives
How to put all these indicators and dashboards to good use?
When starting this quality monitoring project, our objectives were to track the whole chain of production, from requirements (user and software) to tests (unit and integration) and code.
As they are all artifacts in Squore, with available quality indicators, we just need to translate these needs into OKR: Objective & Key Results
- Objective: The product must be useful and maintainable
- Key results:
- Critical requirements are fully covered
- Complex functions are properly tested
- Technical debt is stabilized
- Process is under control
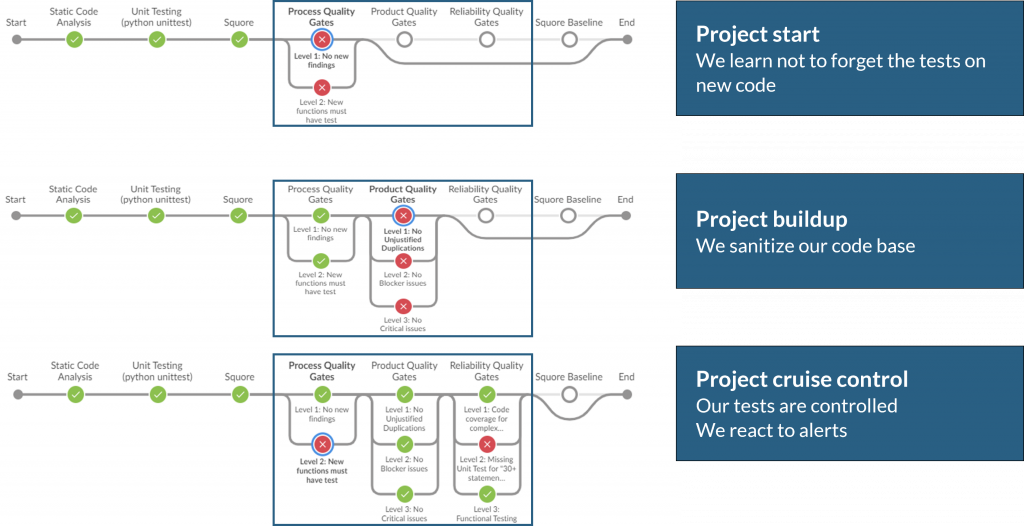
The quality gate concept is a configurable set of checks based on the quality rating results. In our case, we simply had to define it as follows:
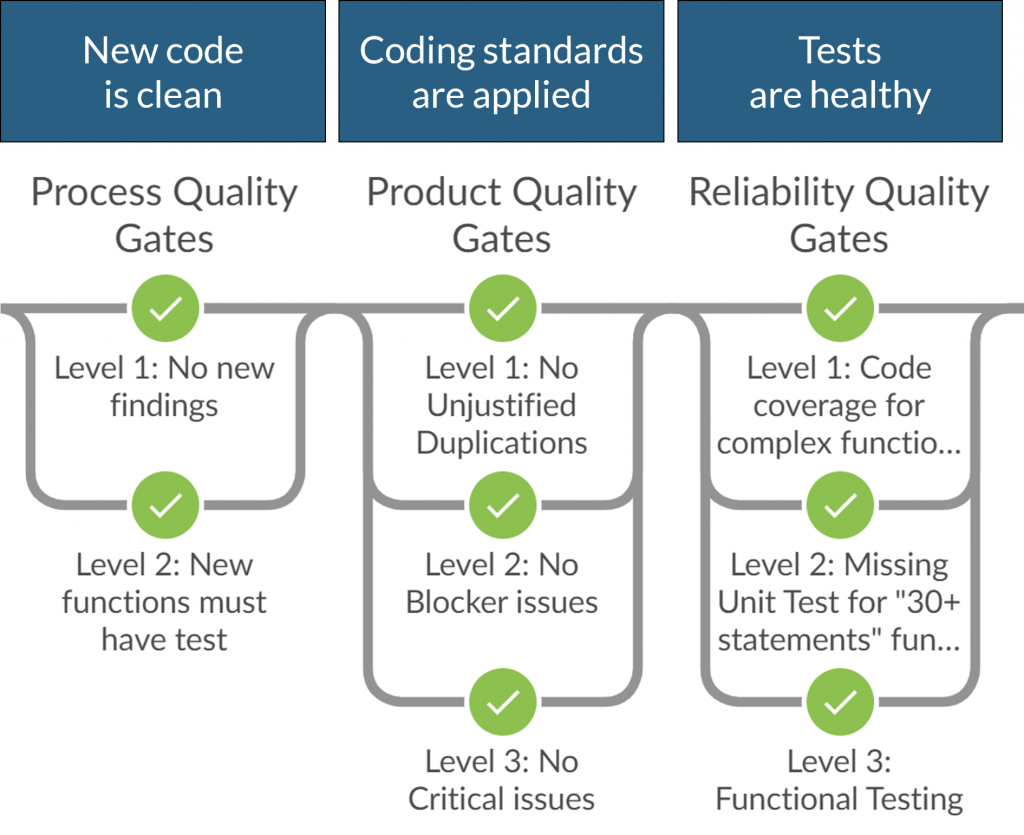
Each time the pipeline was run, the quality gate was checked, and we gradually improved our code with each quality checkpoint:
- The project start was a little rough, as we had to make sure every new piece of code had its associated test. This gradually became a habit, and the quality gate warned us if necessary!
- The buildup is where we had to sanitize our code base, and fix critical or blocker issues, and clean up code duplications. This was hard but rewarding work.
- The “cruise control” phase was reached as we made sure tests were running and passing on the most complex functions.
One year later: Benefits and flaws in our monitoring
After one year using software quality monitoring, what went well, and wrong?
Monitoring benefits:
- We have a fully automated quality rating process that makes us very confident in our development: any new code is of good quality.
- A new developer joining the team mid-project quickly integrated the quality process, as it was clearly followed by everyone, and easy to understand.
- Critical requirements are well covered (but non-critical ones not so well)
This table breaks down requirements coverages along their critical factor (ASIL for automotive, DAL for avionics)
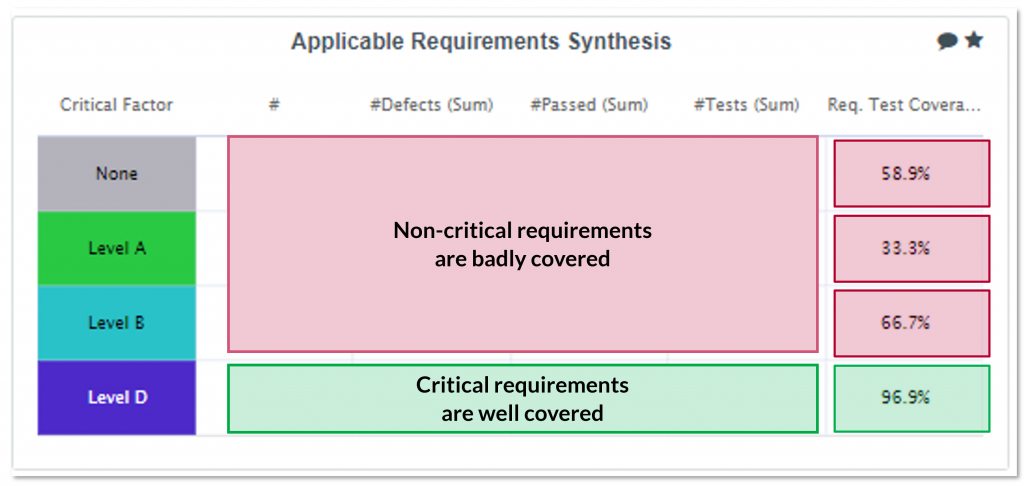
Full traceability between requirements and tests helped reach efficient testing
With this kind of chart, we can track the requirements testing status next to the tests amount and verdicts.

Monitoring flaws
- We sometimes forced “manual baselines” of our code, which introduced uncontrolled technical debt.
This bad practice was not monitored and thus not reported, even if its impacts were eventually visible in the dashboards. - Technical debt derived from complexity is not directly addressed by quality gates, that is a “hole” in our software quality monitoring process.
Conclusions for today, plans for tomorrow
Peace of mind: Using a software quality monitoring tool like Squore, we have definitely improved our development maturity.
Confidence in our product quality means quick and painless deliveries.
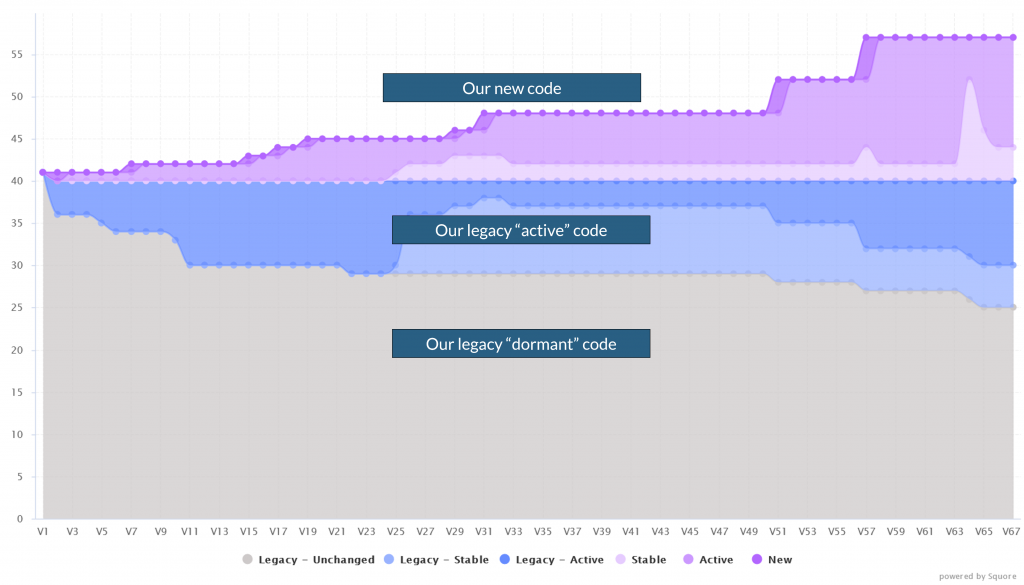
Enhanced clarity: Following the “story” of our source code, it is easy (and fascinating) to see which part of our legacy code remained untouched, and which part was modified. Also, focusing on the new code quality is a good way to build a better future for our project.
The following chart helps visualize our code evolution.
Below the surface, we can separate legacy code from the grey “dormant” (unchanged) to the blue “active” (changed).
Above the surface, the purple “new” code represents our development efforts, and we can clearly see development phases, and correlate them with technical debt.
Software quality monitoring: The conclusion
We have now a working continuous quality framework, and it is fully part of our software quality monitoring process.
Since we have identified the flaws, the next step is to enhance our quality gates to prevent them. We have the data and the indicators to improve complexity-based checks, and to report uncontrolled technical debt spikes. Now it is only a matter of configuring Squore for evolving needs.
In the end, this experience showed us that even if not fully detailed at first, an automated software quality monitoring brought us enough confidence and clarity to consider a finer control.
Reaching better maturity was definitely worth the initial setup, we’re impatient to go even further now 😉
Software quality monitoring explained
You want more visual input? Check out the video with more details: Measuring software quality and assessing OKRs
- How to reach continuous quality monitoring? 5:24
- Quality gates used to assess OKR 7:36
- An exciting first week of monitoring 10:15
- Benefits reached after one year 11:50
- Focus on tests, technical debt and requirements 14:03
- Focus on the review process 19:56
- Are our quality gates efficient? 22:20
- How to improve our process? 24:38
Get started with your projects
Squore product information: Analytics for software projects monitoring


