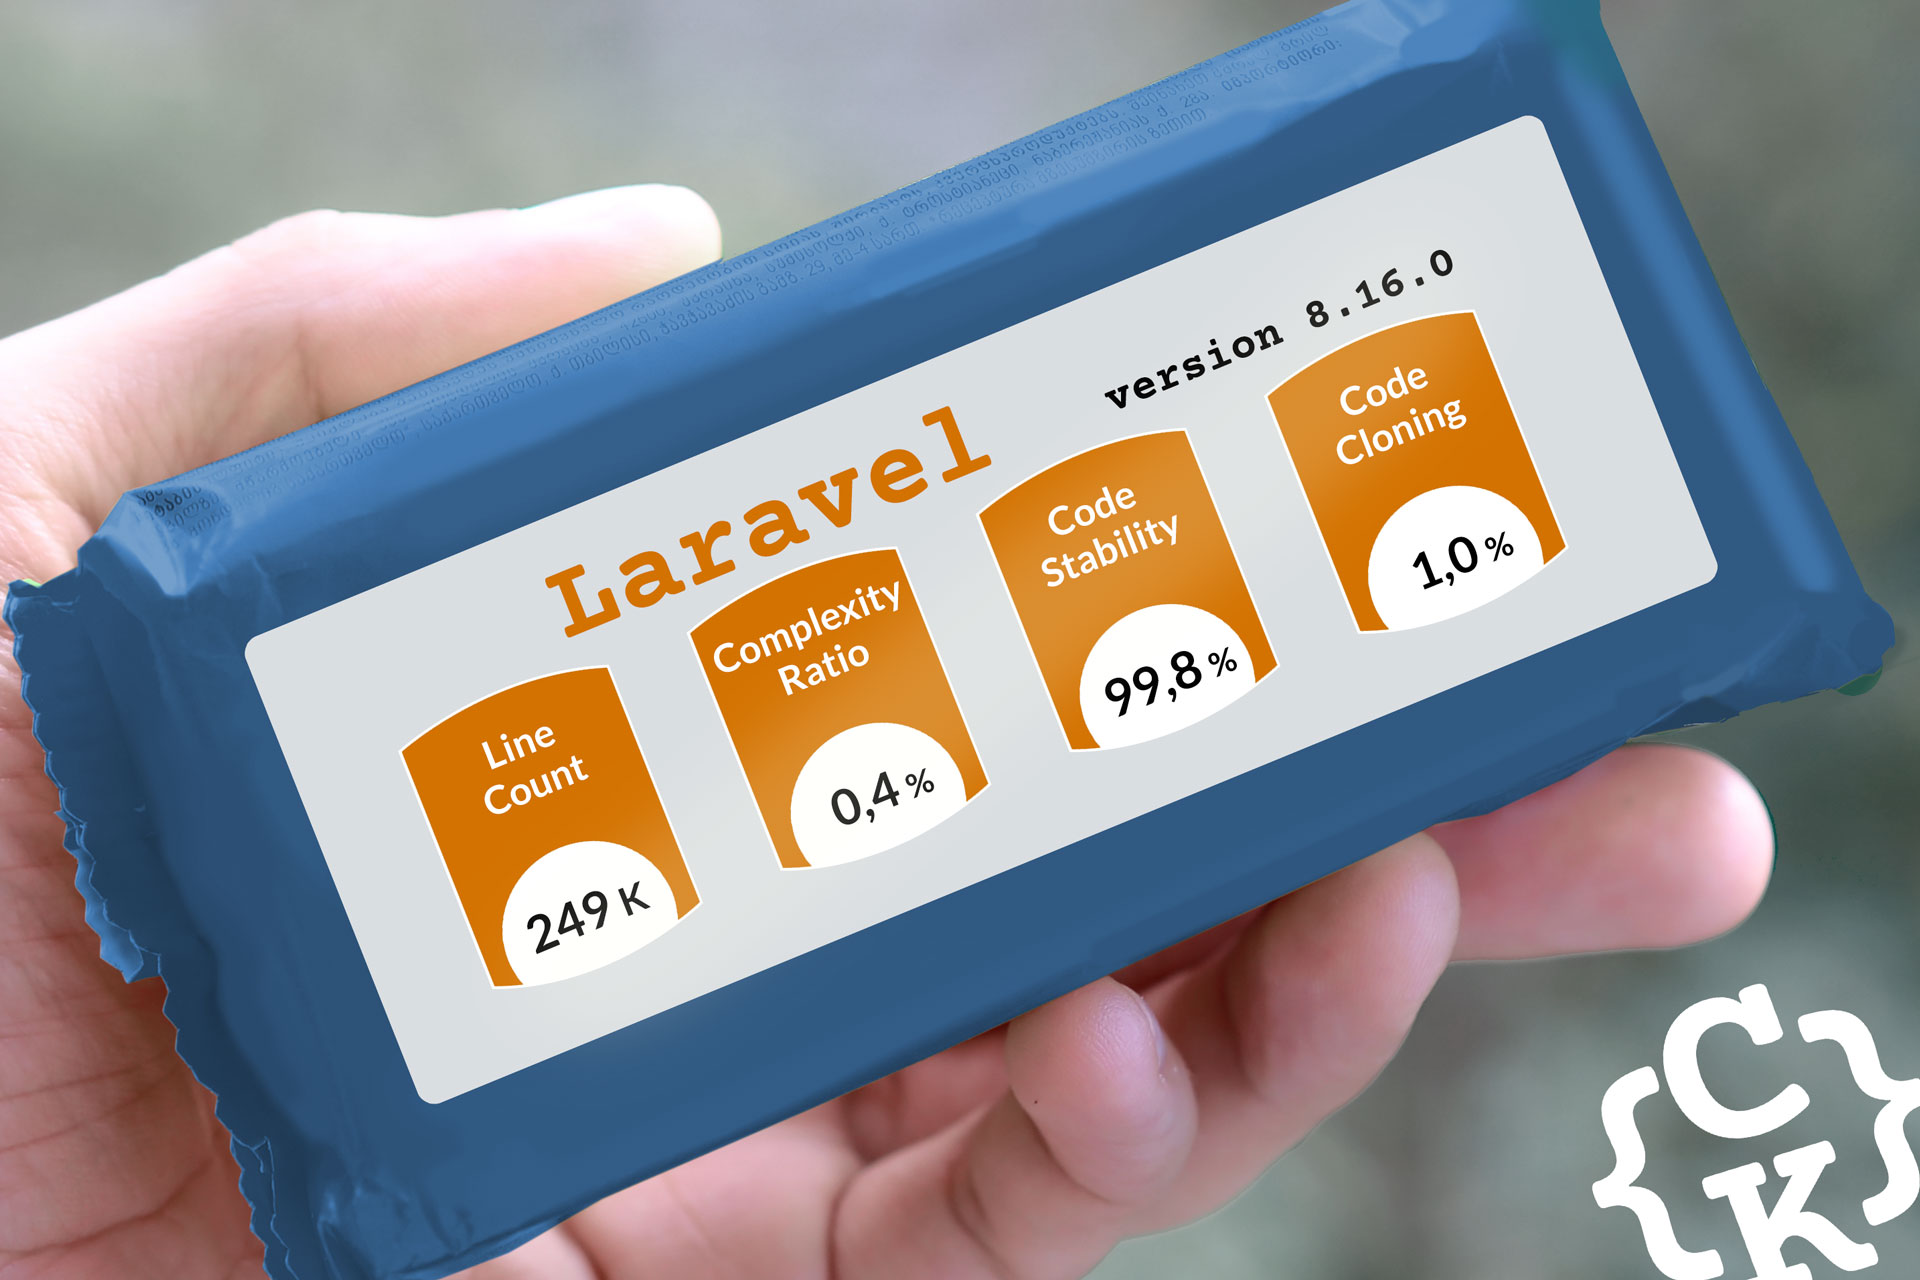
What is it?
Laravel is part of the Web Framework family.
Its official website describes it as “a web application framework with an expressive, elegant syntax. We believe development must be an enjoyable, creative experience to be truly fulfilling. Laravel attempts to take the pain out of development by easing common tasks used in the majority of web projects”
This powerful development tool aims at making the developer life easier (this is always welcome!) in such tasks as dependency injection, schema migration, etc. And on top of that, the documentation and resources are rich and detailed too.
We include Laravel systematically in our software quality monitoring of GitHub projects.
Important note: If you notice that the project’s latest versions are not visible in our monitoring, it’s normal. We regularly update our base, but not continuously, to leave time for the code to properly evolve.
So come back regularly, as new versions are added to our monitoring, and trigger new analyses.
Big picture – overall view on software quality in Laravel
Project size
Laravel is a PHP only project.
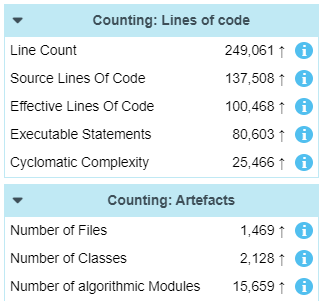
The analyzed version (8.16.0) counts :
- over 249k lines of code (about 100k of which are effective code)
- 1469 files
- 15659 functions
Laravel – Project complexity
- This project has a fairly low complexity ratio
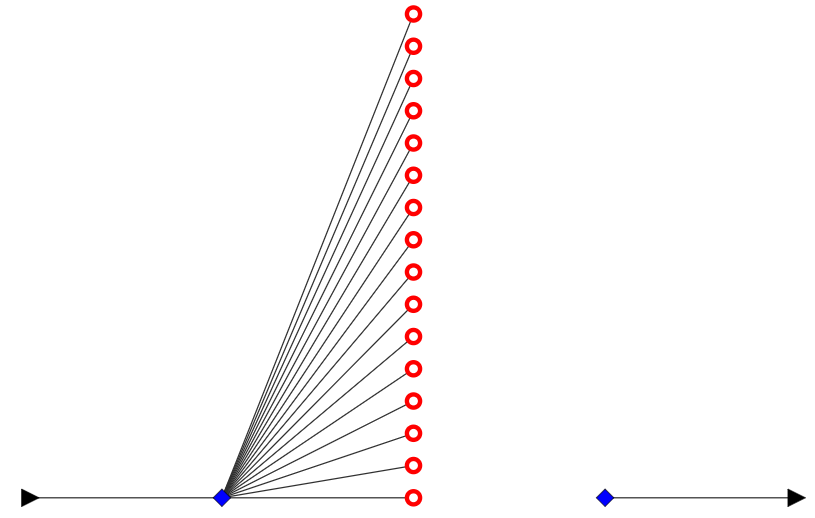
For version 8.16.0, complex functions represent less than 0.4% of the code volume. - The most complex function is 302 lines long, and has been flagged because of its multiple exit points (which is not so bad), and its (beautiful) control graph looks like this:
Laravel – Technical debt
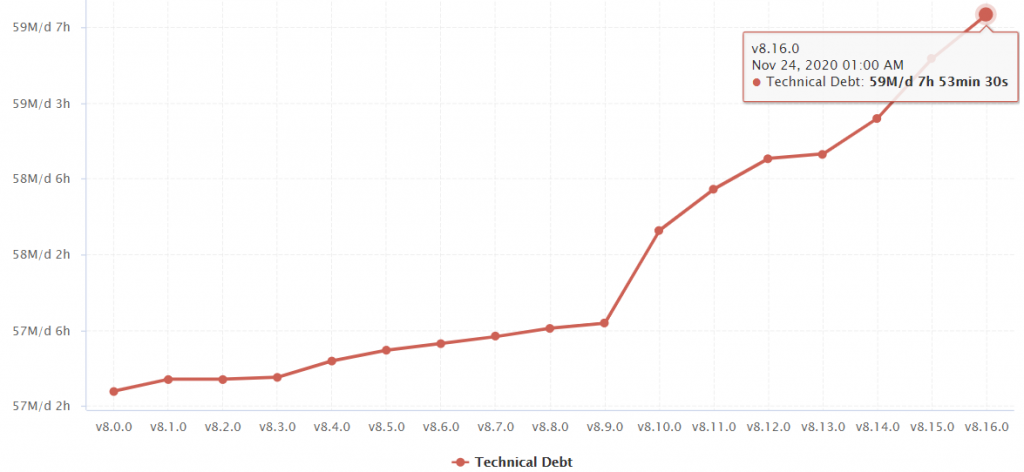
- The overall Technical Debt is over 59 days
- The “New Technical Debt” (for added code) is 1h34′
- The “Modified Technical Debt” (for modified code) is 2 days and 1h
- The “Unchanged Technical Debt” (for unmodified code) is 57 days and 4h
More about measuring and monitoring technical debt
Software quality analysis: Why did we focus on Laravel?
The project trend indicators (Project Activity, Complexity Ratio, Technical Debt), each slightly changed one way or another (less than 5% variation).
So in essence it seems there was no radical change since the previous version. But we can see the Complexity Ratio is on a slight decrease and the Technical Debt on a slight increase.
Let’s take a look and see what’s behind this status.
Exploring the dashboard
Let’s open the Code Quality dashboard for Laravel version 8.16.0.
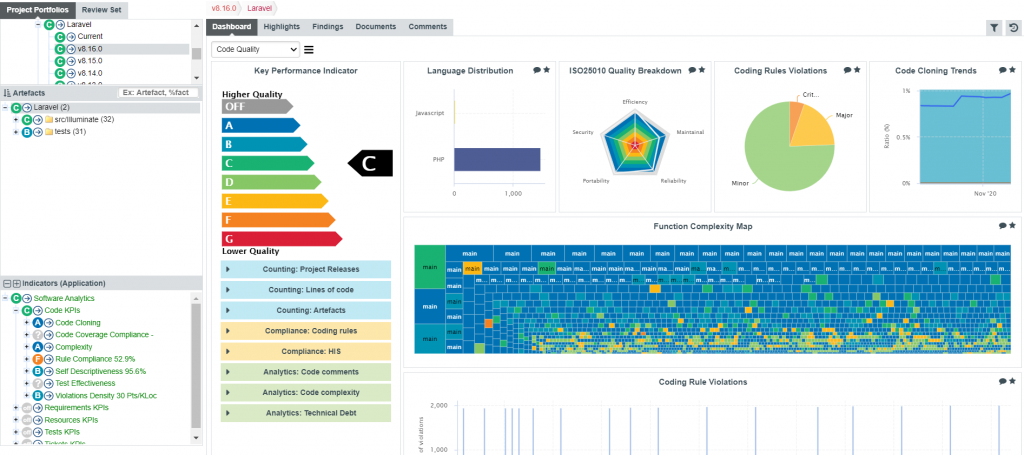
- Let’s start with the Complexity Ratio trend
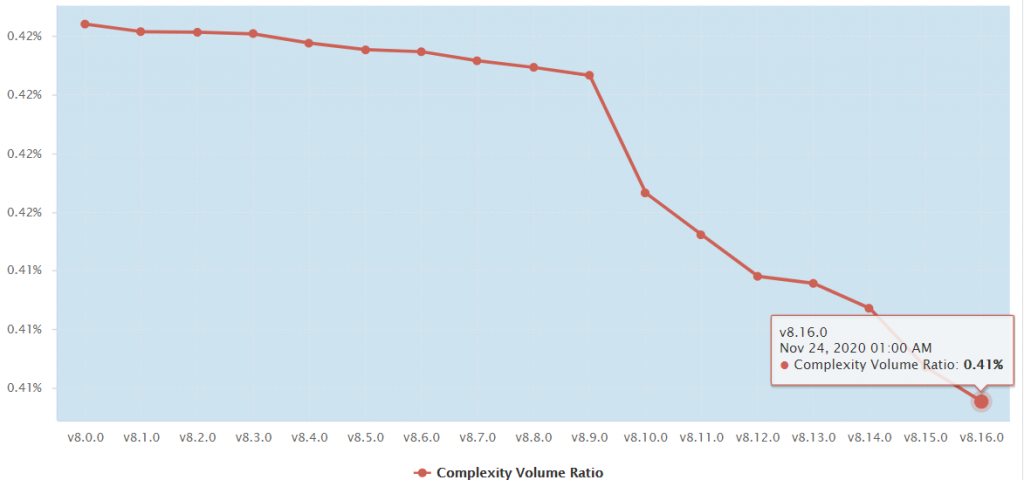
First, as with all charts, be mindful of how it is displayed, because it can be deceptive.
Here, for example, it seems the Complexity Ratio decrease is significant since the last 8 versions.
But looking at the vertical scale, we can see that this “decrease” goes in fact from 0.42% down to 0.41%, which is not so significant after all.
But still, there is a little decrease, and that’s why the trend indicator signaled a small variation.
And looking at the project statistics (below), it is quite logical, since there are 15k+ functions, and the complex ones are very few (which is a good sign)
- Exploring the Technical debt
Choosing the “Technical debt” dashboard, we can look at the breakdown by ISO characteristic, the trend, or analysis by rule violations density.
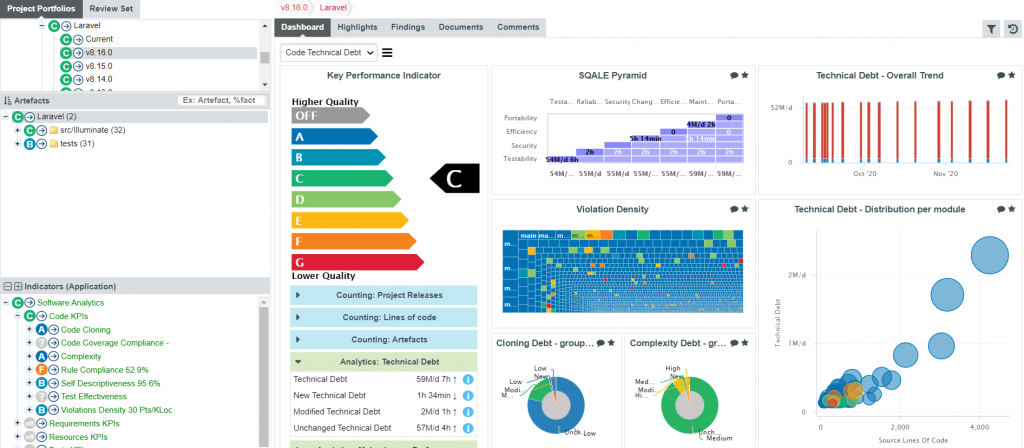
The “Analysis: Technical Debt” table is simple, but already provides interesting information
Remember this is an initial analysis, which can be refined with proper tuning (see our “Important note” below )
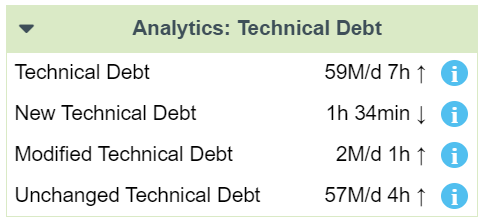
What can we understand about Laravel’s software analysis from this table?
The “Technical Debt” is over 59 days.
That’s the cumulated time combining rule violations remediation cost, as well as complexity.
It is increasing indeed, as the trend shows, but let’s look deeper before jumping to conclusions.
New, Modified and Unchanged Technical Debt
These values break down the first count across code elements (aka “Artefacts”), depending if they have been created or modified since the last version, or if they have not changed at all.
In this case, we can see that unchanged artefacts are responsible for 57 days of Technical Debt, out of 59 days in total.
Which leaves:
– 1h34 Technical Debt attached to new artefacts
– 2 days 1h Technical Debt attached to modified artefacts
Putting things into perspective, we can see that actual work on the code generated a much more manageable amount of Technical Debt, once we discard the “Unchanged Technical Debt”.
Current value vs. speed
Using the current value of Technical Debt for analysis is good if we want an overall picture of the project: past and present.
But if we speak of monitoring, we need to understand the evolution, and track impacts of code change.
The speed of Technical Debt, or its variation provides important knowledge, leading to concrete actions: it is definitely easier to deal with an hour and a half of corrections, compared to 59 days.
Important note: To compute the Technical Debt on this real life code, we used a standard set of programming rules. This has helped us discuss the value of trend vs absolute value, but it is not a full image of the project itself.
To achieve a “full resolution” analysis, we’d need to calibrate the ruleset, and adjust the thresholds to fit the dev team practices.
We’ll continue exploring projects from our showcase in future “Software Quality Analysis” posts!


