In our previous six part series, we explored software quality, from concepts to benefits as a part of the development process. Now, what if we were to build a tool that supports these concepts, and delivers these benefits for efficient monitoring? Let’s begin a new exploration called “Inside Software Quality”, pointing out the essential qualities this tool should have.
And to begin at the beginning, what do we need to look at? The answer is, as often, contrasted: the big picture and little details.
Little details are where raw quality data live
Deep down, quality assessment uses metrics. And these metrics are attributes for every single component of the project. For example, in the source code portion of the project, we work with functions, described by:

- Metrics: lines of code, effective code, statements, nesting depth, etc.
- Checks: Coding rule violations, duplication and cloning detection, etc.
- Links: Associated tests, requirements or even bugs
A quality model will use all these raw data to compute and prioritize meaningful indicators.
And since we eventually act on specific components, our actual work is done at the finest level.
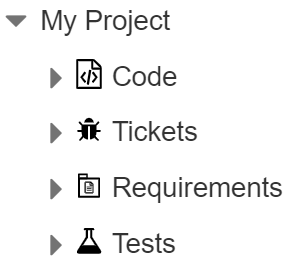
Imagine the project was a tree, and to enhance quality we need to access all the leaves.
This means code elements, but also tests, requirements, bugs and more.

–
The big picture is where quality gets smarter
As we just saw, we need details to efficiently act on project components, that’s where the work is done.
But the big picture level can also provide useful insights.
The quality model aggregates raw data from all project components. If we use the tree analogy, the quality of each leaf impacts the quality of their branches, all the way to the root.
The further we travel towards the root, the more knowledge we can obtain from these quality indicators.
From a higher point of view, we no longer deal with raw data, but we can see invisible things at the lower levels, thanks to:
- A synthetic view:
- Grouped components (“A class of functions”, “A Test suite of test cases”)
- Typed components (“All source files”, “All requirements”)
- Whole project (“Project ‘A’ has Code and Tests”, “Project ‘B’ has Requirements and Tests”)
- Analysis possibilities:
- By component filtering (“What functions have newly failing tests?”, “What requirements were added without tests?”)
- By quality indicators analysis (“What critical functions are badly covered?”)

At the big picture level, we can make decisions based on an aggregated quality assessment.
Big picture + little details = More confidence
As a conclusion, both angles are essential to a confident approach of software quality monitoring:
- The big picture angle helps us to decide where quality needs attention:
You know why an action is required - The little details angle helps us to act on the relevant components:
You know where an action is needed
An efficient monitoring tool should combine both angles: while assessing quality, and also while displaying it.
So, we know we need to zoom in and out on the quality data. But where do these data come from in the first place?
I can’t resist using the tree analogy one last time: in the next post, we will explore how to feed our software project tree!


