Let’s continue exploring what we need to efficiently monitor software quality: in the previous post we saw that we need the big picture as well as the little details. And these data come in so many shapes and flavors that it could be easy to get lost in translation, trying to handle them all. Should we break the data silos?
Breaking the data silos
“Breaking the silos” has become a popular phrase. In our context of software development quality, we refer to activities related to software production.
At the first glance, this means source code, and test silos:
- To check code, quality managers can use information from static analysis, complexity analysis, rule checking, execution benchmarks.
- To check tests, we obviously need to focus on test results, but also availability, duration, stability.
And taking a step back (to look at the big picture), the project quality also includes requirements, design, resources, validation, change management silos.
And anyway, what does it mean to break data silos?
- First: don’t break anything
We want to make sure we preserve each silo’s context. There are precious know-how and good practices from each silo to translate into silo-specific quality indicators.
This is where we will find, for example, Standard Compliance or technical debt, which rely on the source code alone. - Then: draw connections
We need to use connections between data from different silos whenever possible, creating transverse quality indicators.
For example, Code Coverage or Test Effectiveness are computed by connecting the Code and Test silos.
Hence, we need connectors which know how to “speak” each silo’s language, in order to provide data in a common language, and create both silo-specific and transverse quality indicators.
Handling data from the same silo
So far, the concept is rather simple: we need to know how to retrieve code metrics, read test results, and put everything together. Pretty easy, right?
Well, not quite, as you might anticipate.
Let’s just focus on the code and test silos, and suppose you want to produce an indicator to check whether complex functions have been tested properly and are compliant to a standard. For that, you need info from static analysis, rule checking and test.
- How many code analysis tools are there? (many)
- Same question for rule checkers? (a lot)
- What about testing frameworks? (more than a few)
Let’s suppose we know which three tools we work with, and we have the appropriate connectors “speaking their language” to feed software quality.
What if we decide mid-project to add a new tool to get complete data?
And if we change projects, and the team doesn’t use the exact same tools?
And if one of the tools is upgraded, and slightly changes its data model?
All these scenarios mean that within the same silo, we also need to handle different tools (different languages), to continue to provide data in a common language.
It doesn’t matter whether you use “Test Framework A” or “Testing Tool B”, you will still provide the test data, and produce quality indicators regardless of the origin of raw data.

The data aggregation phase
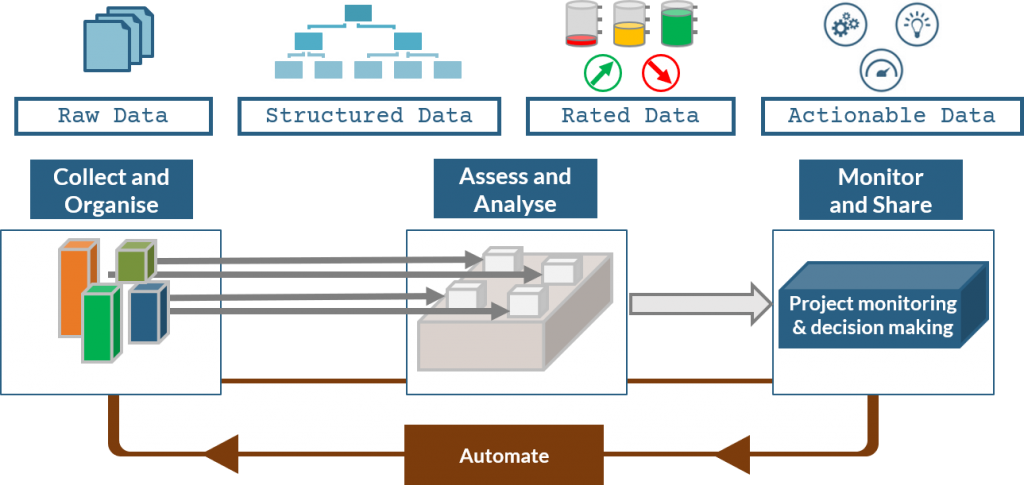
Data aggregation is the first phase of the software quality process. It is crucial because it connects to tools from all the silos, speaking their individual language.
The first objective is to produce a single view where all data relevant to quality are present and connected.
The second objective is to keep producing this view independently of the actual tools in use.
We now have a beautiful, unified network of data, we’re ready to apply a Rating model and produce indicators 🙂


