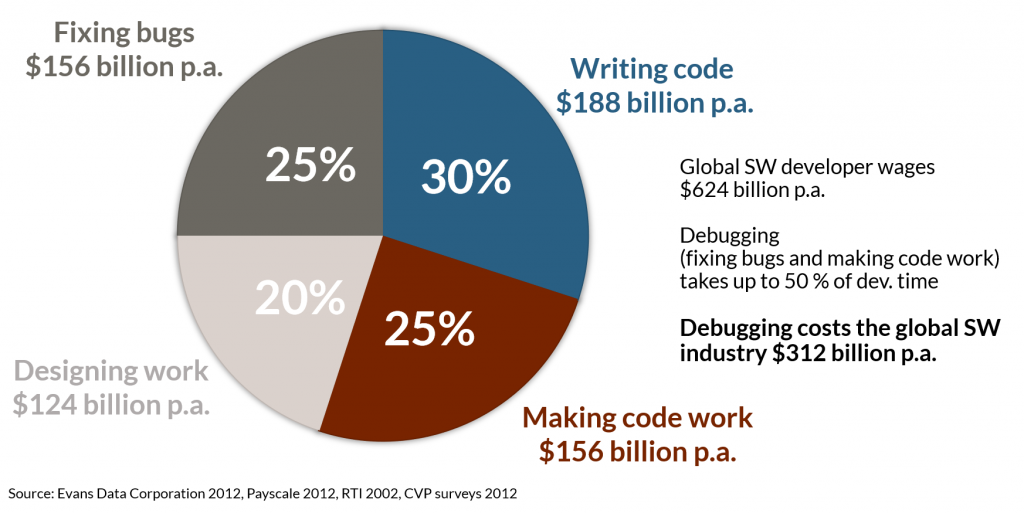
As software continues to eat the world, failures caused by bugs have never been more visible or higher profile. These bugs can result in delays in shipping software on time, with over 80% of embedded projects shipping late. Failure to identify and remediate bugs on time can significantly impact a company’s reputation with its customers and partners. Thereby directly impacting the company’s revenue and valuation.
High costs for debugging and fixing code
For example, in a widely publicized case associated with Baxter, they were ordered by the FDA to recall and destroy all colleague volumetric infusion pumps in the market. This occurred despite Baxter making repeated efforts to correct device flaws. The financial impact was $400–$600m pre-tax “special charge” for recall costs.
As code becomes more complex, finding and fixing bugs is correspondingly harder. Particularly difficult to locate are bugs that strike intermittently and only under certain conditions. Replicating the exact scenario that leads to an intermittent bug appearing is exceptionally time-consuming, and often impossible. In fact, in the software industry, 25% of a developer’s time is spent on debugging and fixing code today.

How to debug large and complex systems?
As a result, it’s reasonable that developers will make every effort to make debugging the applications easier to help in these potential situations in the future. Fixing bugs is typically done through debugging in a two-step process;
(1) figuring out where the bug is,
(2) then figuring out how to fix it.
Traditional techniques for debugging include:
- General-purpose debuggers – stepping through the program execution using breakpoints
- Special case diagnosis/analysis tools – analyze the source code using program analysis tools, e.g. static code analysis
- Programmatic techniques – write the program in a way that can find bugs, e.g. logging
Analysis tools are generally only suitable for catching common bug patterns such as ‘buffer overflows’ or ‘memory leaks’. General-purpose debugging is unsuitable for multi-threaded or distributed systems due to the significant interference they impose on the system under debug. For larger and more complex systems, programmatic techniques are popular. Programmatic techniques typically involve instrumentation of the code and collecting the output in a log allowing for a post-mortem review to diagnose the failure.
Debug code – sometimes dead live longer
While the programmatic debugging technique is critical for finding and fixing bugs, there is a significant risk that the debug code may accidentally be left behind after the bug is remediated. When debug code isn’t removed, the application may accidentally leak sensitive information, resulting in a potential security breach. In fact, this is such a common occurrence, The MITRE Corporation has provided a category for it as a type of Common Weakness Enumeration (CWE™). CWE™ is a community-developed list of software and hardware weakness types. It serves as a common language, a measuring stick for security tools, and a baseline for weakness identification, mitigation, and prevention efforts. CWEs related to left-behind debugging code are:
- CWE – 215 – Insertion of Sensitive Information into Debugging Code
The application inserts sensitive information into debugging code, which could expose this information if the debugging code is not disabled in production. - CWE – 489 – Active Debug Code
The application is deployed to unauthorized actors with debugging code still enabled or active, which can create unintended entry points or expose sensitive information. - CWE-1295 – Debug Messages Revealing Unnecessary Information
The product fails to adequately prevent the revealing of unnecessary and potentially sensitive system information within debugging messages.
When a CWE is identified in a version of the application that is in production, it is assigned a CVE and published in a list of publicly disclosed cybersecurity vulnerabilities. A CVE record contains an identification number, a description, and at least one public reference for publicly known cybersecurity vulnerabilities. CVE records are used in numerous cybersecurity products and services from around the world, including the U.S. National Vulnerability Database (NVD).
Examples for security vulnerabilities caused by debug code
Some recent examples of CVEs associated with CWE-215, CWE-489 & CWE-1295 in software applications are :
- CVE-2020-7958 biometric data disclosure vulnerability in OnePlus 7 Pro Android phone
- CVE-2020-1987 GlobalProtect App: VPN cookie local information disclosure
- How WordPress Plugins Leak Sensitive Information Without You Noticing
To understand how significant and severe these vulnerabilities potentially are, we can consider a detailed example of this kind of CWE that occurred in HP Laptops. In this case, hidden software that could record every letter typed on an HP Laptop was discovered. The impact was far-reaching, with many HP Laptop models at the time being impacted by the finding. In our next post we will investigate the keylogging issue, and then discuss a better method for preventing this and similar debugging related problems from happening in the future.


